

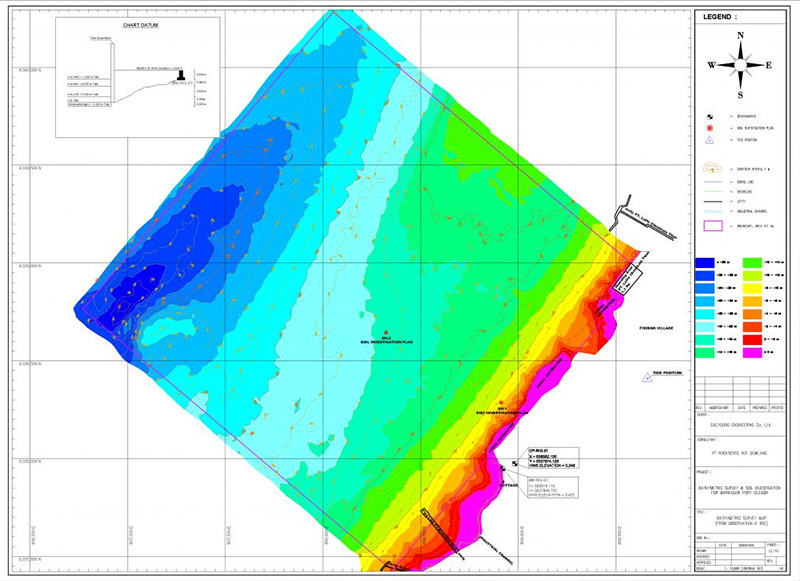
For projects across the UAE, this information can be particularly important for ports, harbours, dredging operations, coastal developments, marine construction, environmental studies, reservoirs, offshore infrastructure, and other projects where understanding underwater conditions is essential.
This guide explains the typical components of a bathymetry survey report, what the different maps and datasets mean, and what clients should check before accepting the final survey deliverables.
 A professional bathymetric survey report should identify the principal equipment used during data acquisition.
Depending on the project, this may include:
A professional bathymetric survey report should identify the principal equipment used during data acquisition.
Depending on the project, this may include:
 For many clients, the bathymetric depth map is one of the most immediately useful outputs.
It provides a visual representation of underwater depth across the surveyed area.
Depending on the deliverable format, different depth ranges may be represented using contours, labels, shading, or colour gradients.
A depth map can help stakeholders identify:
For many clients, the bathymetric depth map is one of the most immediately useful outputs.
It provides a visual representation of underwater depth across the surveyed area.
Depending on the deliverable format, different depth ranges may be represented using contours, labels, shading, or colour gradients.
A depth map can help stakeholders identify:
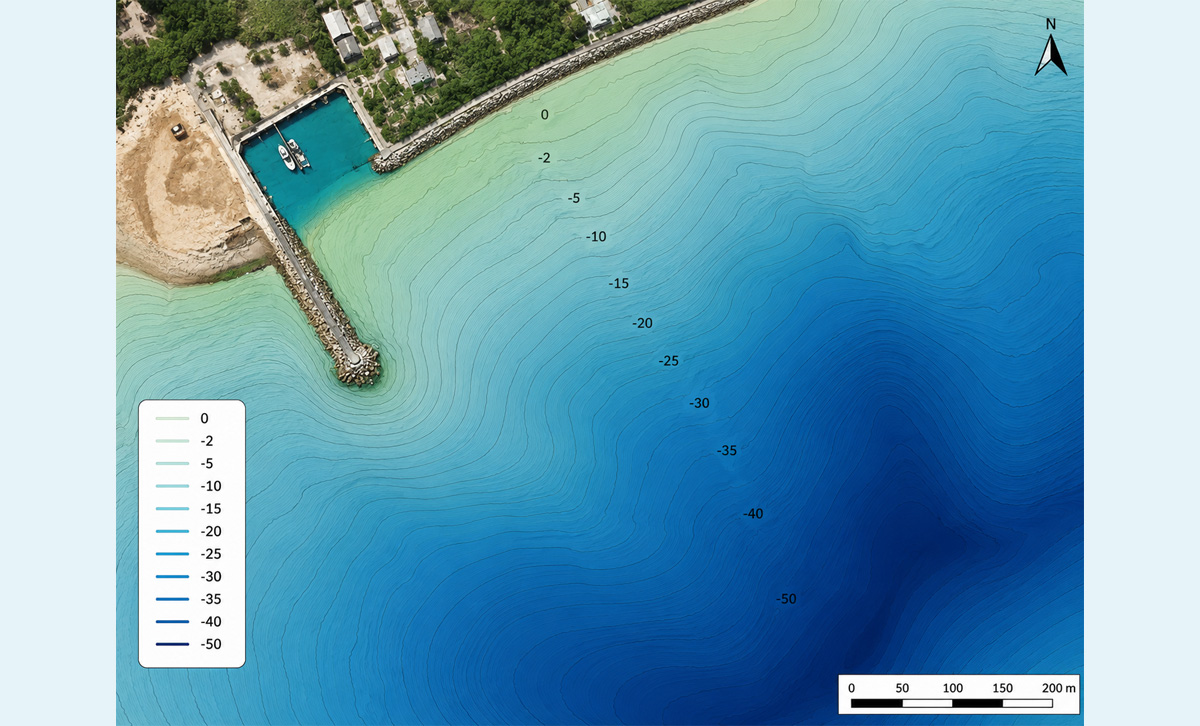 Bathymetric contours work in a similar way to contours on a land topographic survey.
Instead of representing land elevation, they connect points representing equal seabed levels or depths.
Closely spaced contours generally indicate a relatively rapid change in underwater elevation, while widely spaced contours indicate a more gradual change.
Contour maps can be valuable for:
Bathymetric contours work in a similar way to contours on a land topographic survey.
Instead of representing land elevation, they connect points representing equal seabed levels or depths.
Closely spaced contours generally indicate a relatively rapid change in underwater elevation, while widely spaced contours indicate a more gradual change.
Contour maps can be valuable for:
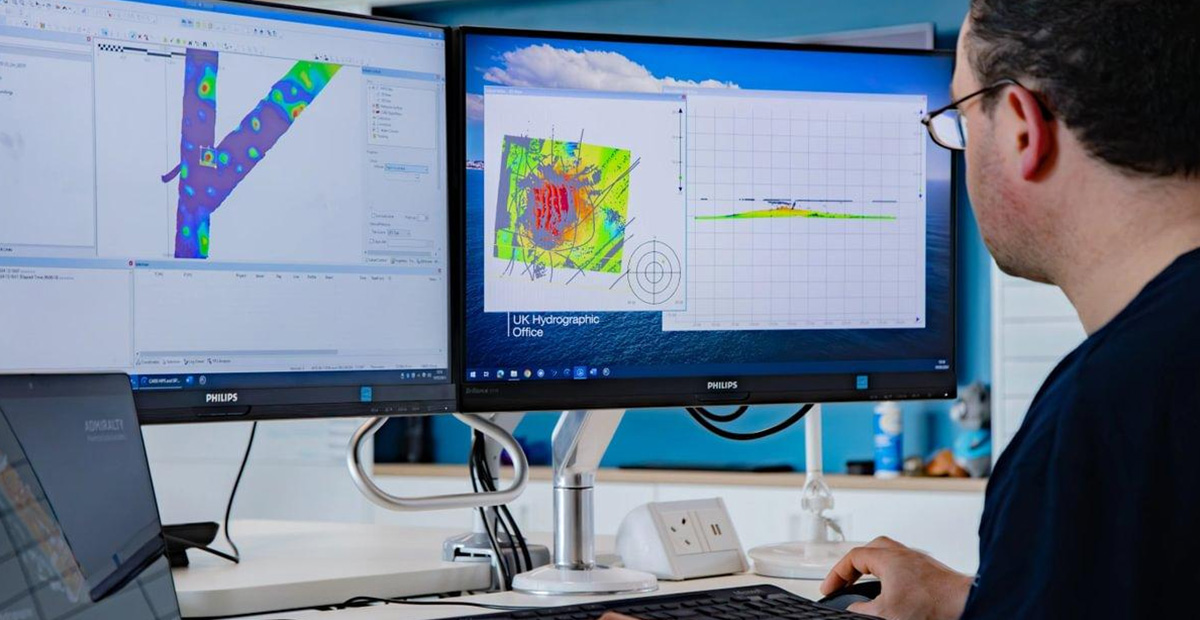 A professional bathymetry survey report should not simply present measurements, it should provide information about their quality.
Quality-control procedures may involve:
A professional bathymetry survey report should not simply present measurements, it should provide information about their quality.
Quality-control procedures may involve:
Not every project requires every deliverable.
The correct package should reflect what the information will actually be used for.
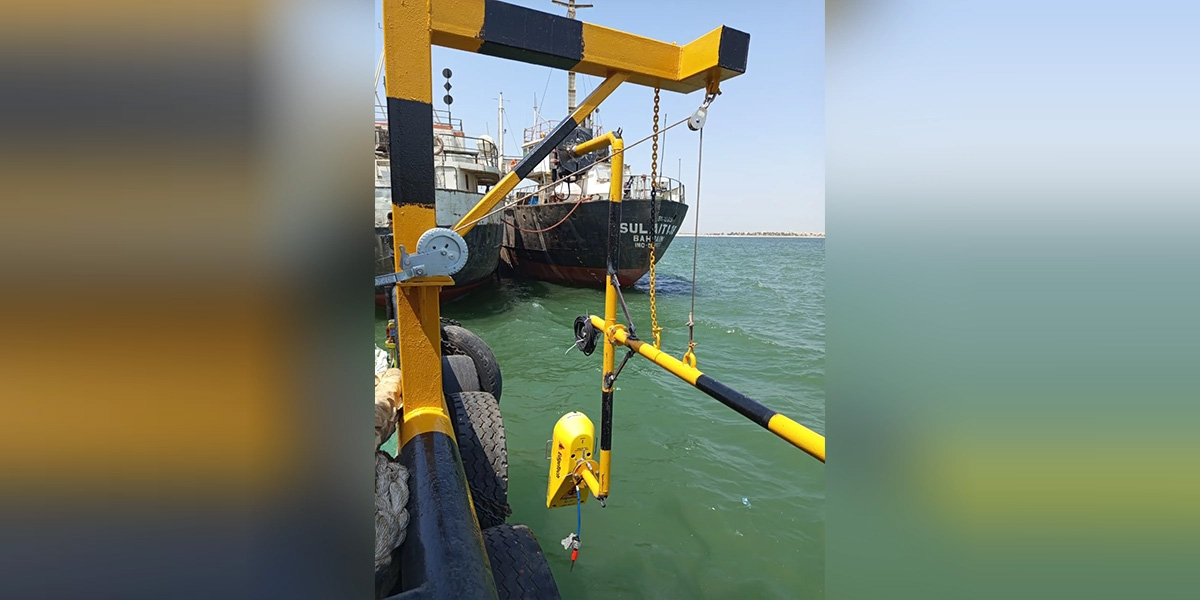 The value of a bathymetric survey depends on more than the echo sounder used to collect depths.
A capable survey provider should understand the complete workflow from survey planning and positioning through data acquisition, corrections, processing, quality control, mapping, and final reporting.
When evaluating a bathymetric survey company, consider:
The value of a bathymetric survey depends on more than the echo sounder used to collect depths.
A capable survey provider should understand the complete workflow from survey planning and positioning through data acquisition, corrections, processing, quality control, mapping, and final reporting.
When evaluating a bathymetric survey company, consider:
Our bathymetric survey workflows combine appropriate hydrographic survey technologies with positioning, data processing, quality control, and professional reporting to transform underwater measurements into practical project information.
Depending on the project requirements, bathymetric survey data can support detailed seabed mapping, marine construction planning, dredging assessment, environmental monitoring, infrastructure development, and long-term change analysis.
By defining the project objectives and required deliverables before fieldwork begins, our survey team can develop an appropriate approach for collecting and presenting the information stakeholders need.
A well-prepared report provides the technical context behind the measurements, explaining where the survey was completed, how the data was collected, which reference systems were used, what corrections were applied, how the information was quality-checked, and what the final results reveal about the underwater terrain.
Depending on the project, the final package may include bathymetric contour plans, depth maps, XYZ data, digital terrain models, cross-sections, profiles, CAD drawings, GIS datasets, and supporting technical documentation.
For developers, consultants, contractors, marine engineers, environmental specialists, and asset owners in the UAE, understanding these deliverables is essential. The right bathymetric information can support better planning, safer marine construction, more reliable dredging assessment, environmental monitoring, and informed management of marine and coastal assets.
The most important principle is simple: the survey report should be designed around the decisions the data needs to support.
By working with an experienced bathymetric and hydrographic survey provider such as Accurate Survey, project teams can ensure that underwater measurements are transformed into clear, traceable, and usable information for engineering and project decision-making.
What Is a Bathymetry Survey Report?
A bathymetry survey report is the technical record and presentation of the results obtained from measuring and mapping underwater terrain. During a bathymetric survey, specialized equipment is used to determine water depths and the shape of the seabed. Depending on the project requirements, survey data may be collected using single-beam or multibeam echo sounders, positioning systems, tide or water-level measurements, and other hydrographic equipment. Raw measurements collected in the field generally require processing before they can be used reliably. Surveyors may need to account for factors such as:- Vessel position
- Sensor offsets
- Water-level or tidal variations
- Sound velocity
- Vessel motion
- Survey datum
- Erroneous or anomalous soundings
- Required coordinate reference system
Why Is the Bathymetry Survey Report Important?
A bathymetric map can show you where the seabed is shallow or deep. A complete survey report goes further by explaining how those results were obtained and how they should be interpreted. This distinction matters because underwater measurements may influence significant engineering and operational decisions. For example, bathymetric information may be used to:- Plan dredging operations
- Assess available water depths
- Design marine structures
- Evaluate seabed levels around existing structures
- Support port and harbour development
- Plan offshore installations
- Monitor sediment accumulation
- Assess erosion and scour
- Support environmental investigations
- Calculate changes in underwater terrain
- Provide baseline information for future monitoring
What Information Is Usually Included in a Bathymetry Survey Report?
The exact format depends on the purpose, client specification, authority requirements, water environment, survey technology, and intended use of the data. However, a professional report will commonly address the following areas.1. Project Information and Survey Objectives
The opening section usually explains why the bathymetric survey was undertaken. This establishes the context for everything that follows. Project information may include:- Project name
- Client or consultant
- Survey location
- Survey dates
- Survey area
- Purpose of the survey
- Scope of work
- Required deliverables
- Relevant specifications or standards
2. Survey Location and Coverage
The report should clearly identify where the survey was conducted and the extent of the area covered. This information may be shown in a survey location plan or coverage map that outlines the project boundary and the surrounding area. Depending on the project, the drawing may identify:- Survey boundary
- Shoreline
- Marine structures
- Piers or jetties
- Channels
- Breakwaters
- Existing infrastructure
- Survey lines
- Control points
- Reference features
3. Survey Equipment and Technology
A professional bathymetric survey report should identify the principal equipment used during data acquisition.
Depending on the project, this may include:
Single-Beam Echo Sounder
A single-beam echo sounder measures depth directly beneath the survey platform along individual survey lines. It can be suitable for projects where defined depth profiles or systematic line coverage meet the survey requirements.Multibeam Echo Sounder
A multibeam echo sounder collects multiple depth measurements across a swath of the seabed. This can provide much denser coverage and support the development of detailed three-dimensional representations of underwater terrain.GNSS Positioning System
Accurate positioning is essential because every valid depth measurement needs to be associated with a horizontal location. GNSS and related positioning technologies allow surveyors to accurately georeference bathymetric measurements.Motion Sensors
For certain vessel-based surveys, motion sensors may be used to account for vessel movements such as roll, pitch, and heave.Sound Velocity Equipment
Because acoustic measurements depend on the propagation of sound through water, sound velocity information may be collected and applied where required.Tide or Water-Level Monitoring Equipment
Bathymetric measurements may need to be referenced to a defined vertical datum.Therefore, water-level observations are an important part of the survey process, especially in areas affected by tides. Documenting the equipment used provides important context regarding how the measurements were acquired.4. Survey Methodology
The methodology section explains how field data was collected. Rather than simply stating that a bathymetric survey was completed, a useful report should describe the survey approach. Information may include:- Survey platform or vessel
- Survey line arrangement
- Line spacing
- Cross-line configuration
- Positioning method
- Depth measurement method
- Equipment setup
- Sensor offsets
- Calibration procedures
- Water-level observations
- Sound velocity measurements
- Data logging procedures
5. Horizontal and Vertical Reference Systems
One of the most important sections of any bathymetric survey report is the description of the reference systems used. Every depth value needs context. A report should therefore identify the applicable:- Horizontal coordinate reference system
- Projection
- Horizontal datum
- Vertical datum
- Units of measurement
- Benchmark or control information, where relevant
Why Does the Vertical Datum Matter?
Imagine that a bathymetric drawing shows a seabed elevation of -6.2 m. That number is incomplete unless the reader knows what zero level it references. For engineering design, dredging calculations, navigation studies, and comparison with previous surveys, all datasets need to use compatible reference systems or be correctly transformed. A clear statement of the vertical reference is therefore essential when interpreting bathymetric data.6. Tide and Water-Level Corrections
Water levels change over time, particularly in tidal environments. If two depth measurements are taken at different stages of the tide without applying the appropriate corrections, comparing them directly could produce misleading results. Bathymetric processing may therefore involve reducing measured depths to an agreed vertical reference. A survey report may document:- Tide station or water-level source
- Observation period
- Reference benchmark
- Correction methodology
- Vertical datum
- Applied water-level adjustments
7. Sound Velocity Corrections
Acoustic echo sounders calculate depth based on the travel time of sound through water. However, the speed of sound in water is not constant. It can be influenced by factors including:- Temperature
- Salinity
- Pressure
- Water depth
8. Data Processing and Cleaning
Raw hydrographic data is not normally treated as the finished product. It must be reviewed and processed to identify measurements that may have been affected by noise, temporary objects, acoustic interference, poor returns, positioning problems, or other factors. Processing can include:- Applying positioning corrections
- Applying water-level corrections
- Applying sound velocity corrections
- Accounting for vessel motion
- Removing invalid soundings
- Filtering noise and spikes
- Reviewing overlapping survey lines
- Generating bathymetric surfaces
- Producing contours
- Conducting quality-control checks
9. Bathymetric Depth Map
For many clients, the bathymetric depth map is one of the most immediately useful outputs.
It provides a visual representation of underwater depth across the surveyed area.
Depending on the deliverable format, different depth ranges may be represented using contours, labels, shading, or colour gradients.
A depth map can help stakeholders identify:
- Shallow areas
- Deep areas
- Channels
- Depressions
- Raised seabed areas
- Sloping terrain
- Irregular seabed formations
- Potential areas of sediment accumulation
10. Bathymetric Contour Map
Bathymetric contours work in a similar way to contours on a land topographic survey.
Instead of representing land elevation, they connect points representing equal seabed levels or depths.
Closely spaced contours generally indicate a relatively rapid change in underwater elevation, while widely spaced contours indicate a more gradual change.
Contour maps can be valuable for:
- Marine engineering
- Dredging design
- Coastal development
- Channel assessment
- Reservoir studies
- Pipeline and cable planning
- Environmental studies
- Seabed monitoring
11. Digital Terrain Model or Bathymetric Surface
Processed survey measurements can be used to create a digital representation of the seabed. Depending on project requirements, this may be supplied as a gridded bathymetric surface, Digital Terrain Model (DTM), or another compatible digital format. These models help technical teams visualize underwater topography and perform further analysis. Applications may include:- Engineering design
- Surface comparison
- Dredging analysis
- Volume calculations
- Hydrodynamic modelling
- GIS analysis
- Environmental assessment
- Monitoring seabed changes
12. XYZ Bathymetric Data
Clients may also receive processed XYZ data. In simple terms:- X = horizontal position
- Y = horizontal position
- Z = elevation or depth
13. Longitudinal Profiles and Cross-Sections
For certain projects, bathymetric information may be presented through profiles and cross-sections. These provide a vertical view of the underwater terrain along a defined alignment. Profiles can be useful for:- Navigation channels
- Pipelines
- Subsea cables
- Dredging areas
- Marine structures
- Rivers
- Canals
- Reservoirs
14. Identified Seabed Features and Obstructions
Depending on the survey scope and sensors used, a bathymetric survey may reveal features that require further attention. These could include:- Localized high points
- Depressions
- Scour areas
- Sediment accumulation
- Submerged structures
- Debris
- Seabed irregularities
- Potential obstructions
15. Survey Accuracy and Quality Control
A professional bathymetry survey report should not simply present measurements, it should provide information about their quality.
Quality-control procedures may involve:
- Equipment checks
- Calibration records
- Positioning verification
- Cross-line comparisons
- Review of overlapping data
- Detection and removal of erroneous soundings
- Assessment of data coverage
- Verification of applied corrections
- Evaluation against project specifications
16. Survey Limitations and Site Conditions
A reliable survey report should also communicate relevant limitations. No surveying method should be interpreted without considering the conditions under which the data was collected. Potential limitations may include:- Restricted vessel access
- Extremely shallow water
- Structures blocking survey coverage
- Rough water conditions
- Heavy marine traffic
- Acoustic interference
- Dense vegetation in inland waters
- Difficult seabed conditions
- Temporary obstructions
- Safety or access restrictions
What Are the Typical Bathymetric Survey Deliverables?
The final deliverables should be established before fieldwork begins because different project teams require different formats. A typical package may include:| Deliverable | What It Provides | Typical Use |
|---|---|---|
| Bathymetry Survey Report | Methodology, equipment, processing, references and results. | Technical review and project documentation. |
| Bathymetric Contour Plan | Seabed elevations represented by contour lines. | Design and engineering assessment. |
| Depth Map | Visual representation of water depths. | Planning and rapid interpretation. |
| XYZ Data | Numerical coordinates and seabed levels. | CAD, GIS and engineering analysis. |
| Digital Terrain Model (DTM) | Digital representation of underwater topography. | 3D analysis, modelling and comparison. |
| Cross-Sections | Vertical representation across selected alignments. | Engineering and dredging assessment. |
| Longitudinal Profiles | Seabed levels along a project alignment. | Channels, pipelines and cables. |
| CAD Drawings | Engineering-compatible survey drawings. | Design and construction. |
| GIS Data | Georeferenced spatial information. | Mapping and spatial analysis. |
| Raw / Processed Data | Survey measurements as specified by the project. | Detailed technical review and future processing. |
How Do You Read a Bathymetric Survey Drawing?
Receiving a detailed bathymetric plan can be overwhelming if you do not regularly work with hydrographic data. Before interpreting individual depths, check five things.1. Check the Datum
Determine the vertical reference used for the depth or elevation values. Never compare bathymetric values from two surveys until you confirm that they are referenced consistently.2. Check the Units
Confirm whether depths and elevations are represented in metres or another unit.3. Review the Contour Interval
The contour interval tells you the vertical difference represented between adjacent contour lines.4. Check the Coordinate System
This is particularly important when integrating the survey into CAD, GIS, BIM, or other engineering datasets.5. Read the Notes and Legend
Symbols, line types, depth labels, boundaries, and other information should be explained through the drawing legend and survey notes. The technical report should be read together with the drawing rather than treated as a separate document.How Bathymetric Reports Support Dredging Projects
Dredging is one of the applications where accurate bathymetric reporting can directly influence project planning and measurement.Pre-Dredging Survey
A bathymetric survey conducted before dredging establishes existing seabed conditions.Post-Dredging Survey
A subsequent survey documents seabed conditions after dredging. When compatible methods and reference systems are used, the two datasets can be compared to assess changes in the seabed. This information can support:- Verification of dredged levels
- Identification of remaining high areas
- Volume assessment
- Project progress monitoring
- Documentation for technical review
Bathymetry Survey Reports for Marine Construction
Marine construction projects require a reliable understanding of the underwater environment before design and construction activities proceed. Bathymetric data can support projects involving:- Ports
- Harbours
- Jetties
- Breakwaters
- Bridges
- Marine terminals
- Offshore structures
- Coastal protection
- Subsea pipelines
- Cable routes
Bathymetric Reporting for Environmental Monitoring
Bathymetric surveys are not limited to construction. They can also support environmental and coastal studies by providing repeatable information about underwater terrain. When surveys are conducted at different times using compatible methodologies, analysts can investigate changes associated with:- Sediment movement
- Coastal processes
- Erosion
- Deposition
- Scour
- Habitat modification
- Dredging
- Marine development
Why Comparing Bathymetric Surveys Requires Care
A common assumption is that two bathymetric surveys can simply be placed on top of each other and the difference calculated. In reality, meaningful comparison requires consistency. Before comparing surveys, technical teams should check:- Horizontal coordinate system
- Vertical datum
- Survey equipment and methodology
- Data density
- Surface resolution
- Water-level correction
- Processing procedures
- Survey coverage
- Accuracy requirements
What Should You Check Before Accepting a Bathymetry Survey Report?
Before approving the final deliverables, project owners and consultants should confirm that the report answers several fundamental questions:- Does the survey cover the complete required area?
- Is the purpose and scope clearly documented?
- Are the horizontal and vertical reference systems stated?
- Is the equipment used clearly identified?
- Is the survey methodology explained?
- Are relevant water-level and acoustic corrections documented?
- Are quality-control procedures described?
- Are any survey limitations clearly stated?
- Do the drawings clearly show units, scales, legends and reference information?
- Have all required digital formats been supplied?
- Can the data be integrated into the client’s CAD, GIS or engineering workflow?
- Does the survey meet the accuracy and deliverable requirements defined for the project?
Why Project Requirements Should Be Defined Before the Survey
One of the best ways to obtain useful bathymetric deliverables is to define the end use before data collection begins. A client should ideally tell the survey provider:- Why the survey is required
- What area must be covered
- What accuracy is needed
- Which coordinate system is required
- Which vertical datum is required
- Whether repeat surveys will be compared
- What contour interval is needed
- Whether profiles or sections are required
- What CAD/GIS formats are needed
- Whether raw or processed datasets are required
- Which authority, client, or project specification applies
Choosing a Bathymetric Survey Company in the UAE
The value of a bathymetric survey depends on more than the echo sounder used to collect depths.
A capable survey provider should understand the complete workflow from survey planning and positioning through data acquisition, corrections, processing, quality control, mapping, and final reporting.
When evaluating a bathymetric survey company, consider:
- Experience in hydrographic and bathymetric surveying
- Availability of suitable single-beam and multibeam systems
- Positioning capabilities
- Water-level and tidal survey experience
- Hydrographic data-processing expertise
- Quality-control procedures
- Ability to supply CAD and GIS-compatible outputs
- Experience with marine and coastal projects
- Understanding of project and authority requirements
- Ability to explain the final data clearly
Supporting UAE Projects with Accurate Bathymetric Data
Accurate Survey Engineering provides hydrographic and bathymetric surveying solutions for marine, coastal, infrastructure, dredging, environmental, and engineering applications across the UAE.Our bathymetric survey workflows combine appropriate hydrographic survey technologies with positioning, data processing, quality control, and professional reporting to transform underwater measurements into practical project information.
Depending on the project requirements, bathymetric survey data can support detailed seabed mapping, marine construction planning, dredging assessment, environmental monitoring, infrastructure development, and long-term change analysis.
By defining the project objectives and required deliverables before fieldwork begins, our survey team can develop an appropriate approach for collecting and presenting the information stakeholders need.
Conclusion
A bathymetry survey report should tell you far more than how deep the water is.A well-prepared report provides the technical context behind the measurements, explaining where the survey was completed, how the data was collected, which reference systems were used, what corrections were applied, how the information was quality-checked, and what the final results reveal about the underwater terrain.
Depending on the project, the final package may include bathymetric contour plans, depth maps, XYZ data, digital terrain models, cross-sections, profiles, CAD drawings, GIS datasets, and supporting technical documentation.
For developers, consultants, contractors, marine engineers, environmental specialists, and asset owners in the UAE, understanding these deliverables is essential. The right bathymetric information can support better planning, safer marine construction, more reliable dredging assessment, environmental monitoring, and informed management of marine and coastal assets.
The most important principle is simple: the survey report should be designed around the decisions the data needs to support.
By working with an experienced bathymetric and hydrographic survey provider such as Accurate Survey, project teams can ensure that underwater measurements are transformed into clear, traceable, and usable information for engineering and project decision-making.